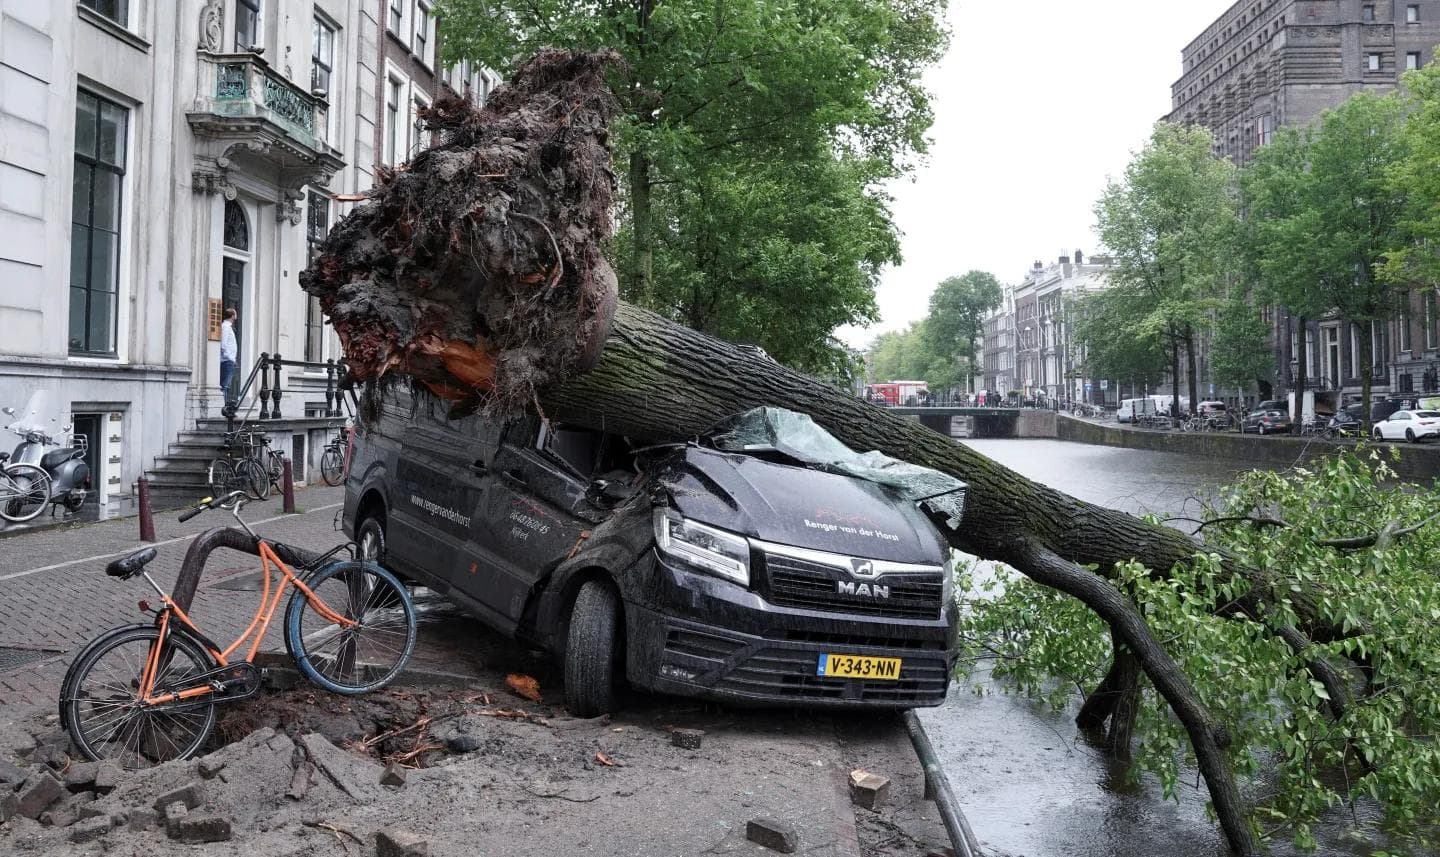
Between June 19 and June 20, 2026, the Benelux (low) countries, northwest of Germany and north of France experienced one of the most severe convective storm systems in recent history. A dramatic break in a regional heatwave triggered an atmosphere super-saturated with convective energy, unleashing a historic barrage of lightning, localized hail, and destructive straight-line winds across the Netherlands, Germany and Belgium. Ground-level reports paint a vivid picture of the impact: over 188,000 lightning strikes recorded in a single night, resulting in at least two casualties from falling trees, the paralysis of major rail corridors between hubs like Zwolle and Groningen, and severe property destruction from lightning-induced fires on traditional thatched-roof structures.
While public headlines focus on the immediate aftermath, businesses require precise spatial and temporal data to quantify risk, verify claims, and protect assets. Through our specialized climate intelligence platform at iklim.co, we mapped the precise tracks and severe thresholds of these storm cells as they ripped through Western Europe.
Visualizing the Convective Tracks: The iklim.co Platform Map
Our historical storm visualization map captures the exact paths, center points, and severity indexes of the convective storm cells across the region from June 19 to June 20, 2026. By tracking cell centers dynamically, our platform translates raw lightning data into actionable geographical intelligence.
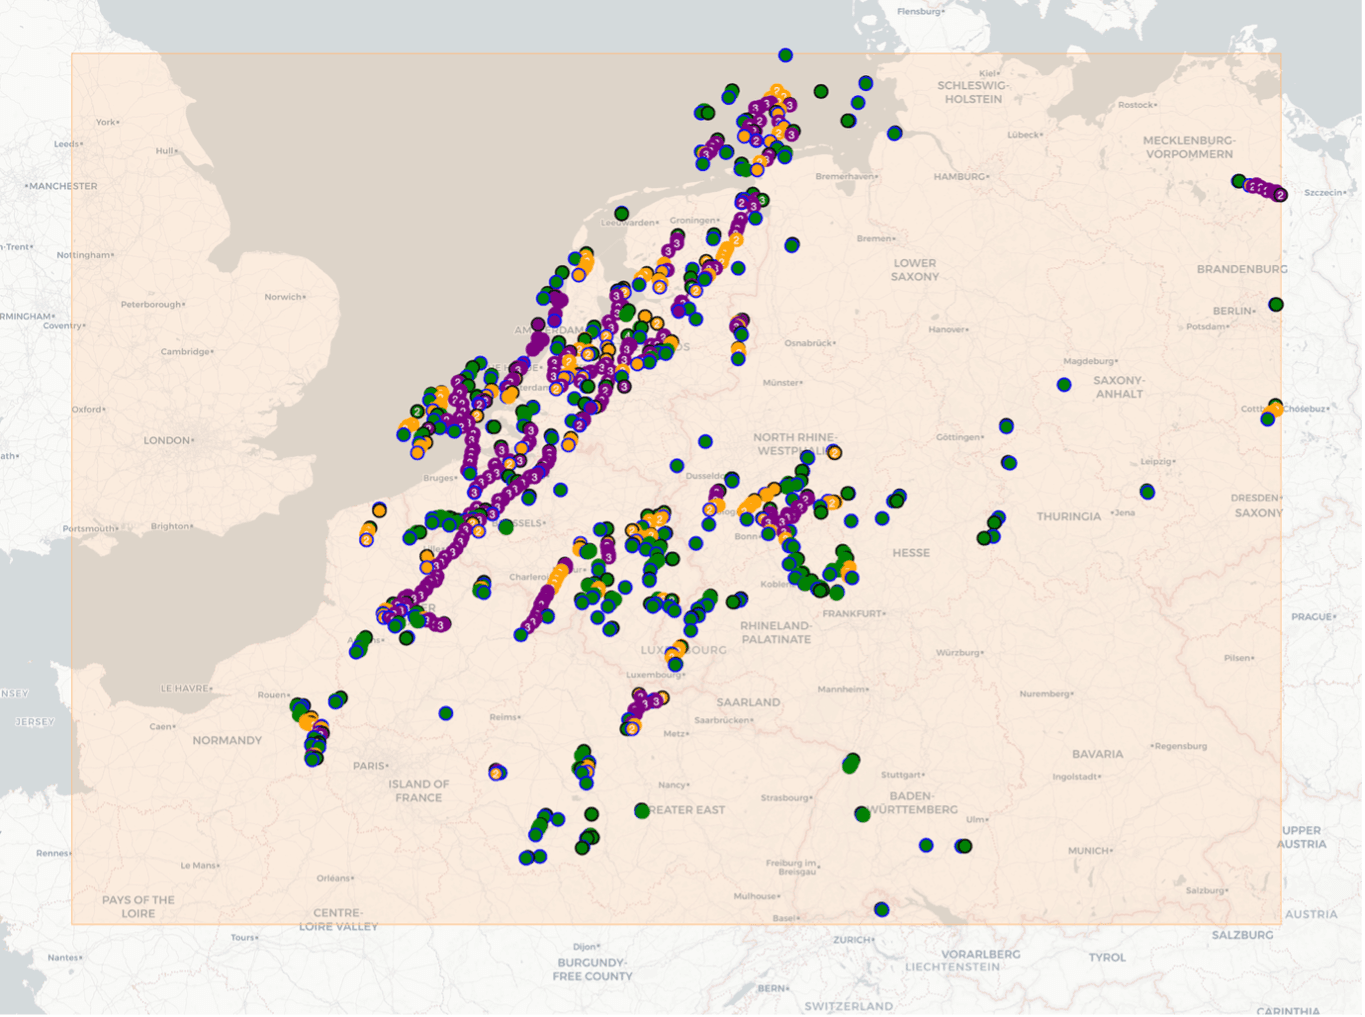
To understand the high-resolution data provided in our interface, the severity of each identified storm cell is categorized by an intuitive, data-driven color gradient:
- Very Severe Storm (Purple Nodes): Represents extreme convective activity. These zones indicate a high probability of severe hail, torrential downpours, and destructive wind gusts that may exceed 100 km/hr. They pose the highest risk to infrastructure and property.
- Severe Storm (Orange Nodes): Marks areas of moderate to high severity. These cells bring prominent precipitation and notable wind loading. While the probability of large hail is lower compared to purple zones, the risk of micro-hail and localized flooding remains significant.
- Light Storm (Green Nodes): Indicates light convective activity. These areas experience persistent rainfall and measurable wind speeds. While lower in immediate risk, cumulative precipitation can still saturate soil and stress drainage assets.
Geographic Analysis: Where the Storm Hit Hardest
A closer look at the iklim.co data reveals a terrifyingly organized progression. The storm tracking map highlights a heavy concentration of purple (very severe) nodes initiating in northern France and cutting like a diagonal scar straight through Brussels, moving northeastward into Belgium's central regions. This aligns precisely with local damage reports of flash flooding and structural grid stress across Flanders and Wallonia.
As the system migrated into the Netherlands, it branched out into distinct hazard corridors. The western branch heavily impacted the dense Randstad area, threatening coastal infrastructure and urban hubs like Rotterdam and Amsterdam. Meanwhile, a dense cluster of purple and orange nodes covers central and eastern Netherlands—stretching toward Twente, Utrecht, and up into the northeastern provinces of Drenthe and Groningen. This spatial concentration explains the severe disruptions to the Dutch national rail network (NS) and the widespread failure of regional tree canopies under intense wind load.
Turning Data into Resilience: Commercial Applications
In an era of accelerated climate volatility, post-event reporting is no longer enough. The granularity provided by iklim.co’s platform empowers multiple sectors to build operational resilience:
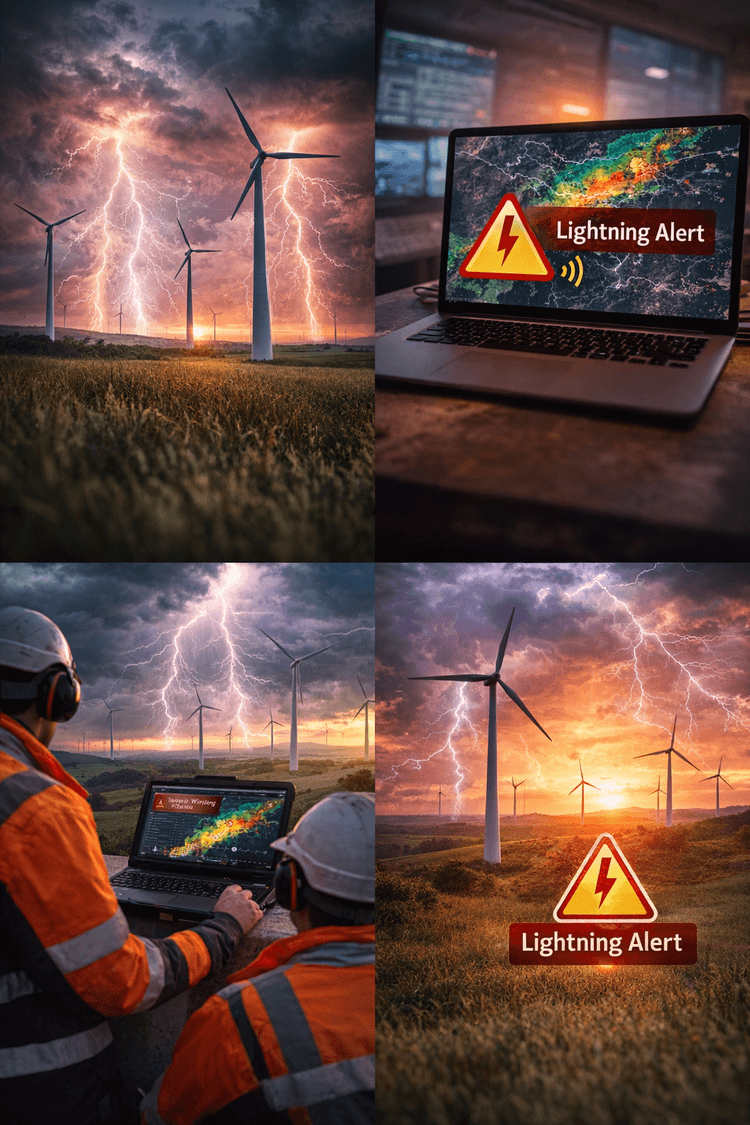
1. Smart Hyper-Local Early Warnings
By leveraging real-time tracking of cell severity, industrial operators and municipalities can deploy proactive alerts well before public systems trigger generic alarms. For logistics, smart cities, and infrastructure providers, this means critical windows to secure loose equipment, safely park transit fleets, and protect personnel.
2. Post-Event "Claim Verification" for Insurers
The insurance sector faces billions in damages following an event of this scale. Distinguishing between a legitimate weather-related claim and pre-existing property damage is a major operational bottleneck. With iklim.co’s precision tracking, insurance companies can input a specific timestamp and coordinate to instantly verify whether a very severe (purple) storm cell with severe hail capacity crossed the exact property boundaries, automating and validating the claims pipeline.
3. Asset Risk Analysis for Wind Turbine Operators
Renewable energy infrastructure is directly exposed to atmospheric extremes. For wind farm operators in the North Sea and onshore throughout the Low Countries, our platform provides comprehensive wind-loading and sudden gust metrics. Analyzing these risks allows operators to evaluate structural fatigue, cross-reference sudden turbine braking events with actual cell severity, and optimize maintenance schedules based on empirical stress history.
Conclusion
The storm of June 19-20, 2026, serves as a stark reminder of the financial and operational risks posed by severe weather. By transforming chaotic meteorological phenomena into structured, high-fidelity geospatial data, iklim.co gives businesses the tools they need to anticipate risk, verify impacts, and safeguard valuable infrastructure.